1 先上效果
可以看到效果涉及:
下面来看看是怎样实现的
2 数据格式
nodes 节点
| key |
value |
| id |
唯一id |
| label |
标签文本 |
| style |
节点样式,如:fill(填充色)、stroke(边缘颜色)、shadowBlur、shadowOffsetX、shadowOffsetY、shadowColor…. |
| description |
描述文本(放大后显示) |
| x |
节点初始位置 |
| y |
节点初始位置 |
| size |
节点大小 |
示例
1
2
3
4
5
6
7
8
9
10
11
12
13
14
15
16
17
18
19
20
21
22
23
24
| const data = {
nodes: [
{
id: '0',
label: 'iCheng',
style: { fill: 'l(0) 0:#ffffff 0.5:#8FE9FF 1:#87EAEF', stroke: '', shadowBlur: 60, shadowOffsetX: 10, shadowOffsetY: 10, shadowColor: '#ADD8E6' },
description: 'See the latest updates to the MDN reference pages about JavaScript regular expressions',
x: 624.0361181340486,
y: 208.12272169694995,
size: 57
},
{
id: '1',
label: 'analyse',
style: { fill: 'l(0) 0:#FFD3C9 0.5: #FFD3C9 1:#ffffff', stroke: '', shadowBlur: 60, shadowOffsetX: 10, shadowOffsetY: 10, shadowColor: '#E6E6FA' },
description: 'Learn what HTML landmark roles are, how they improve accessibility',
x: 538.8142691877796,
y: 236.54991963171793,
size: 78
}
],
edges: [],
};
|
fill
填充色使用渐变色
描边线性渐变
1
2
| // 渐变角度为 0,渐变的起始点颜色 #ffffff,中点的渐变色为 #7ec2f3,结束的渐变色为 #1890ff
'l(0) 0:#ffffff 0.5:#7ec2f3 1:#1890ff'
|
填充环形渐变
1
2
| // 渐变起始圆的圆心坐标为被填充物体的包围盒中心点,半径为(包围盒对角线长度 / 2) 的 0.1 倍,渐变的起始点颜色 #ffffff,中点的渐变色为 #7ec2f3,结束的渐变色为 #1890ff
'l(0) 0:#ffffff 0.5:#7ec2f3 1:#1890ff'
|
3 图配置
基于G6
Graph 是 G6 图表的载体,所有的 G6 节点实例操作以及事件,行为监听都在 Graph 实例上进行
Graph 的初始化通过 new 进行实例化,实例化时需要传入需要的参数。
1
2
3
4
5
6
7
8
9
10
11
12
13
14
15
16
17
18
19
20
21
22
23
24
25
26
27
28
29
30
31
32
33
| const container = document.getElementById('container');
const width = container.scrollWidth;
const height = (container.scrollHeight || 1000) - 20;
const graph = new G6.Graph({
container: 'container',
width,
height,
layout: {
type: 'force',
nodeStrength: 300,
collideStrength: 0.7,
alphaDecay: 0.01,
preventOverlap: true,
},
modes: {
default: ['collapse-expand-combo'],
},
defaultNode: {
type: 'bubble',
size: 80,
labelCfg: {
position: 'center',
style: {
fill: 'black',
fontSize: 6,
fontStyle: 'bold',
},
},
},
});
|
3.1 Force 力导向
Force 布局采用经典的力导向布局方法,将根据节点的信息,施加力使节点尽可能聚集
更多配置可查看文档:https://g6.antv.antgroup.com/api/graph-layout/combo-force
4 节点交互事件
4.1 节点开始被拖拽 node:dragstart
当节点开始被拖拽的时候触发的事件
节点开始被拖拽时,触发 refreshDragedNodePosition 方法
1
2
3
4
| graph.on('node:dragstart', function (e) {
graph.layout();
refreshDragedNodePosition(e);
});
|
4.2 更新节点位置信息 refreshDragedNodePosition
跟随拖动的位置,做相应数据处理
参数e:鼠标拖动信息(包含节点 x、y 坐标信息)
这个方法,会拿到节点当前x、y坐标值,赋予其 fx、fy 属性
fx、fy
当你希望固定某个节点的位置,不受力的影响时,可以在该节点数据中配置 fx 与 fy 作为固定的坐标
如果将 fx 与 fy 置为空,该节点就会继续受力的作用而聚拢
1
2
3
4
5
6
| function refreshDragedNodePosition (e) {
const model = e.item.get('model');
model.fx = e.x;
model.fy = e.y;
}
|
4.3 拖动过程中 node:drag
当节点在拖动过程中时触发的事件
触发 refreshDragedNodePosition 方法
1
2
3
| graph.on('node:drag', function (e) {
refreshDragedNodePosition(e);
});
|
4.4 拖拽完成后 node:dragend
当拖拽完成后触发的事件
将 fx 与 fy 置为空,该节点就会继续受力的作用而聚拢
1
2
3
4
| graph.on('node:dragend', function (e) {
e.item.get('model').fx = null;
e.item.get('model').fy = null;
});
|
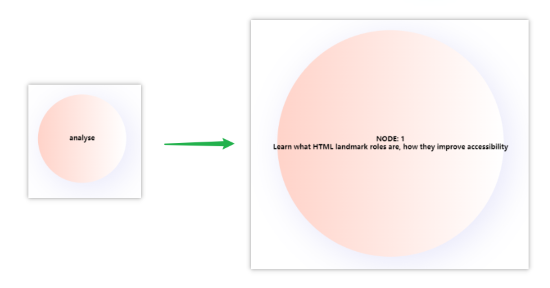
4.5 点击事件 node:click
当节点被点击时触发的事件
通过重置 size 属性,改变节点大小
重置 label 属性,改变节点的文本
再调用 graph.layout() 重新以当前配置的属性进行一次布局
1
2
3
4
5
6
7
8
9
10
11
12
13
14
15
16
17
18
19
20
21
22
23
| graph.on('node:click', function (e) {
const node = e.item;
const states = node.getStates();
let clicked = false;
const model = node.getModel();
let size = 200;
let labelText = 'NODE: ' + model.id + '\n' + model.description;
states.forEach(function (state) {
if (state === 'click') {
clicked = true;
size = model.oriSize;
labelText = model.oriLabel;
}
});
graph.setItemState(node, 'click', !clicked);
graph.updateItem(node, {
size,
label: labelText,
});
graph.layout();
});
|
5 初始化图数据
1
2
| graph.data(data);
graph.render();
|
6 执行时机
因为要操作 DOM,因此上述 JS 代码在 mounted() 调用